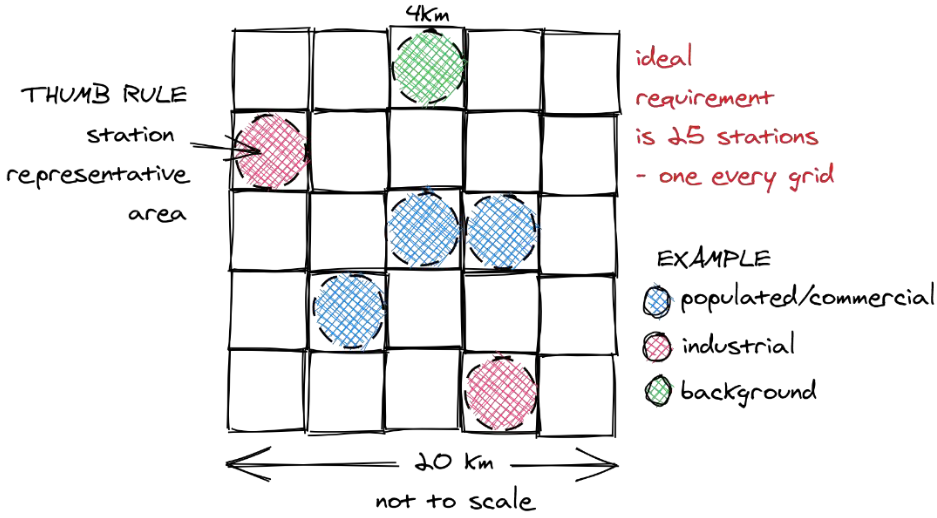
Ever wondered how many air quality stations are required to give a good estimate of the air you are breathing?
Using CPCB guidelines and Landscan 2024 population data, this tool will help you estimate the monitoring requirement for any city.
You can upload the city boundaries or draw it manually and see how many monitors are needed to get good estimate for each pollutant.
You can also play by placing a monitor network inside a city and check if your network covers the city well. Monitoring Network Assessment Tool | Github
For more details on the method, refer this tutorial here: How many monitors are needed?
SciPol Stories [2025]
I've developed animations and visual stories to communicate science and public policy. This is a list of them.
SciPolStories
RAG Chatbot on Constitutional Assembly Debates [2025]
I built an RAG Chatbot on the Constitutional Assembly Debates so that we citizens can better
interact with the wisdom contained in these debates.
CAD Chatbot |
GitHub Constitutional Observer is a far superior project than what I did. I hope they add LLM summary to the queries asked.
Quiz Web app [2025]
I forked an open source quiz React web-app and built upon it:
We want to use this quiz at UrbanEmissions.info for trainings and public engagement purposes.
I integrated it with Google Sheets.
I'm not a front-end dev, but anyone interested in building a simple open-source quiz application can build upon this.
Answer the Air Quality Quiz |
GitHub |
Slide deck
Ozone Sensitivity [2024]
Tropospheric Ozone is a pollutant, unlike the stratospheric Ozone that we want to protect.
Ozone’s presence as a driving factor in the air pollution has increased upto 20% over the last 5 years.
NOx and VOCs react to produce it.
Even though NOx levels are reducing in Indian cities due to BSVI emission standards, Electric vehicles etc.,
we may not see a proportional reduction in Ozone levels.
This is because we have had extremely high amounts of NOx emissions in our cities.
So, we have to focus on VOCs as well (reduce waste burning, stubble burning, biofuels etc).
This research is presented at the iCACGP-IGAC Conference 2024, Kuala Lumpur.
GitHub
Pollution Calculators [2024]
There is no dearth of data on air pollution, but still we lack in action. Why?
One reason is that we are unable to tell what to do about it.
Any solution proferred recieves a stream of excuses of why that is not possible.
These excuses can however be articulated mathematically - as constraints.
Then we can solve the problem at hand - minimising air pollution.
UrbanEmissions.info developed many MS Excel tools that enable practitioners to use the pollution data and tell these stories of what their governments 'should do': Tools
Vivekam is a Twitter(X) bot that tweets wisdom of Swami Vivekananda from his written works.
I'd frequented RK Math in Hyderabad and did good reading of Swami Vivekananda. I am using this bot to re-read his works and broadcast his message of reason, love and inclusion.
GitHub
Samvidhan Bot [2024]
SamvidhanBot is a Twitter(X) bot that tweets wisdom from the Constitution of India and its makers.
It was created on January 26, 2022. Later, Twitter became X, APIs got changed, there are no more free servers available.
Eventually, SamvidhanBot is hosted on my RaspberryPi.
We always need content and newer ideas for the bot. Feel free to contribute.
GitHub |
SamvidhanBot Blog |
TROPOMI Extracts [2023]
TROPOMI (TROPOspheric Monitoring Instrument) is the satellite instrument on board the Copernicus Sentinel-5 Precursor (S5P) satellite.
TROPOMI monitors trace gases and aerosols relevant for air quality and climate.
In this project, TROPOMI data of pollutants NO2, SO2, HCHO and O3 is extracted via Google Earth Engine (GEE).
Data is extracted for 104 airsheds (Indian Cities) at 1000m resolution and for India at 0.1 degree resolution.
GitHub
Plots and CSVs for 104 airsheds:
NO2 |
SO2 |
HCHO |
O3 |
Intelligent Data Solution - Disaster Risk Reduction (IDS-DRR) [2023]
Bed capacity management during COVID-19 in Mumbai [2022]
One of the major problems surfaced during the COVID-19 pandemic is the collapse of health systems in the event of a disaster.
In this project, I took the COVID-19 related data of Mumbai from June 2020 to August 2021.
Along with data on case loads, hospital bed capacity data released by Brihanmumbai Municipal Corporation (BMC) is used in the analysis and forecasting bed capacity in Mumbai.
Read more about this project here: Bed capacity management during COVID-19 in Mumbai
Data-driven environment monitoring at Green War Room - Delhi Government [2022]
This is the first dashboard I'd built for a weekend hackathon at the Indian School of Business (ISB).
We analysed Mission Antyodaya 2019 data to create "Deprivation Index" for each district.
Machine Learning was not required, but we implemented basic K-Means Clustering to sound fancy.
We won the hackathon.
Antyodaya Dashboard |
GitHub